SPHARM Expansion
SPHARM expansion expands the object surface into a complete set of spherical harmonic basis functions  , where denotes the spherical harmonic of degree
  and order
  and it is essentially a Fourier basis function defined on the sphere. The expansion takes the form:

where

and

The Fourier coefficients  up to a user-desired degree can be estimated by solving a linear system. The object surface can be reconstructed using these coefficients, and using more coefficients leads to a more detailed reconstruction.
A sample reconstruction case is shown in Surface Visualization (icosa4, Solid with Mesh): The original model is shown in the left panel and its SPHARM reconstructions using coefficients up to degrees 5 and 15 are shown in the middle and right panels, respectively.
Different spherical sampling schemes can be used to reconstruct the object. In Surface Visualization (quad64, Mesh), the reconstruction shown in the right panel is created using a regular mesh grid on the sphere, and the one shown in the left panel is created using a level 4 icosahedral subdivision.
In SPHARM-MAT, a standard expansion method as described above is implemented for creating the SPHARM descriptors (see Exercise 4.1 SPHARM-MAT Expansion). In addition, SPHARM-PDM can also be integrated for performing SPHARM expansion (see Exercise 4.2 SPHARM-PDM Expansion and SPHARM Expansion PDM Difference).
Exercise 4.1 SPHARM-MAT Expansion
This exercise was tested on a WinXP machine (3GHz CPU, 3.25G RAM) running Matlab 7.7.0 (R2008b). It took a few minutes to finish.
Major Steps
- SPHARM-MAT Expansion
- Surface Visualization (icosa4, Solid with Mesh)
SPHARM-MAT Expansion
Task
Calculate SPHARM coefficients
Input
SpharmMatDir/data/Ex0401/hip03_smo/*_smo.mat: This folder is a copy of SpharmMatDir/data/Ex0302/hip03_smo/*_smo.mat.
Output
SpharmMatDir/data/Ex0401/hip04_des/*_des.mat
Steps
- Make an output directory SpharmMatDir/data/Ex0401/hip04_des
- Run SPHARM_MAT.m under Matlab
- Click Expansion button
- In the right panel, let Method be LSF
- In the right panel, let MaxSPHARMDegree be 15
- In the right panel, select SpharmMatDir/data/Ex0401/hip04_des as OutDirectory
- In the right panel, click ..... button next to Select Input, and select all the *_smo.mat files under SpharmMatDir/data/Ex0401/hip03_smo as input files
- Click OK button (See Screen Capture for SPHARM-MAT Expansion)
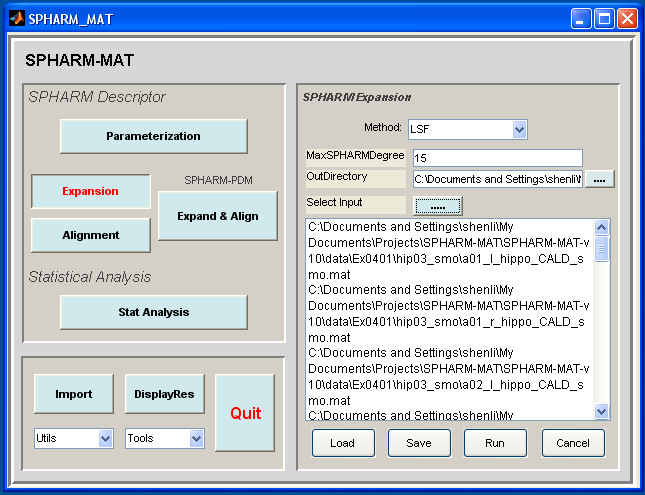
Screen Capture for SPHARM-MAT Expansion
Surface Visualization (icosa4, Solid with Mesh)
Task
Visualize SPHARM reconstruction in object space
Input
SpharmMatDir/data/Ex0401/hip04_des/*_des.mat
Output
SpharmMatDir/data/Ex0401/hip04_des/*_des.mat/PNG/*.png
Steps
Select DisplayObjs under the Utils pop-up menu (bottom-left corner)
Be sure to run this experiments three times by setting different configurations in the right panel as follows
- Run 1 (original surfaces): let Space be object, Mesh be orig, Shade be both, Overlay be none, Export be png, Degree be empty
- Run 2 (SPHARM reconstruction up to degree 5): let Space be object, Mesh be icosa4, Shade be both, Overlay be none, Export be png, Degree be 5
- Run 3 (SPHARM reconstruction up to degree 15): let Space be object, Mesh be icosa4, Shade be both, Overlay be none, Export be png, Degree be 15
In the right panel, click ..... button next to Select Input, and select all the SpharmMatDir/data/Ex0401/hip04_des/*_des.mat files as input files
Click OK button (See Screen Capture for Surface Visualization (icosa4, Solid with Mesh))
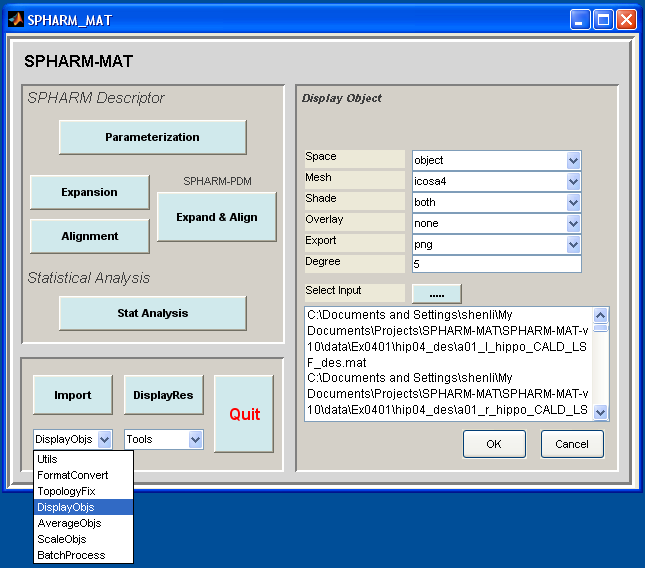
Screen Capture for Surface Visualization (icosa4, Solid with Mesh)
Notes
- The visualization results are saved as PNG files under SpharmMatDir/data/Ex0401/hip04_des/*_des.mat/PNG
- Sample original surface and its SPHARM reconstructions using coefficients up to degree 5 and degree 15 are shown in Surface Visualization (icosa4, Solid with Mesh).
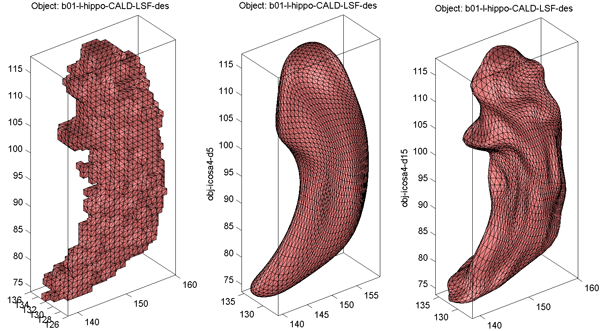
Surface Visualization (icosa4, Solid with Mesh)
Relevant Information
Useful Tips
Exercise 4.2 SPHARM-PDM Expansion
Step 1 of this exercise was tested on a Linux machine (3GHz CPU, 8G RAM) running Matlab 7.5.0 (R2007b) and SPHARM-PDM (Linux64-v1.7), since the windows version of this function is not available. Steps 2-3 of this exercise were tested on a WinXP machine (3GHz CPU, 3.25G RAM) running Matlab 7.7.0 (R2008b) and SPHARM-PDM (WinXP-v1.3). It took a few minutes to finish.
Major Steps
- SPHARM-PDM Expansion
- Format Conversion meta_coef2des
- Surface Visualization (quad64, Mesh)
SPHARM-PDM Expansion
Task
Calculate SPHARM coefficients using SPHARM-PDM
Input
SpharmMatDir/data/Ex0402/hip04_meta/*.meta: This folder is a copy of SpharmMatDir/data/Ex0303/hip04_meta/*.meta.
Output
SpharmMatDir/data/Ex0402/hip05_coef/*.*: SPHARM coefficients are stored in *.coef and SPHARM reconstructions are stored in *.meta.
Steps
- Be sure to run this on a Linux machine, since the window version does not support this function
- Make an output directory SpharmMatDir/data/Ex0402/hip05_coef/
- Run SPHARM_MAT.m under Matlab
- Click Expand & Align button
- In the right panel, let subdivLevel be 20, spharmDegree be 12, FinalFlip be 0, and other options be empty.
- In the right panel, select SpharmMatDir/data/Ex0402/hip05_coef as OutDirectory
- In the right panel, click ..... button next to Select Input, and select all the *.meta files under SpharmMatDir/data/Ex0402/hip04_meta as input files
- Click OK button (See Screen Capture for SPHARM-PDM Expansion)
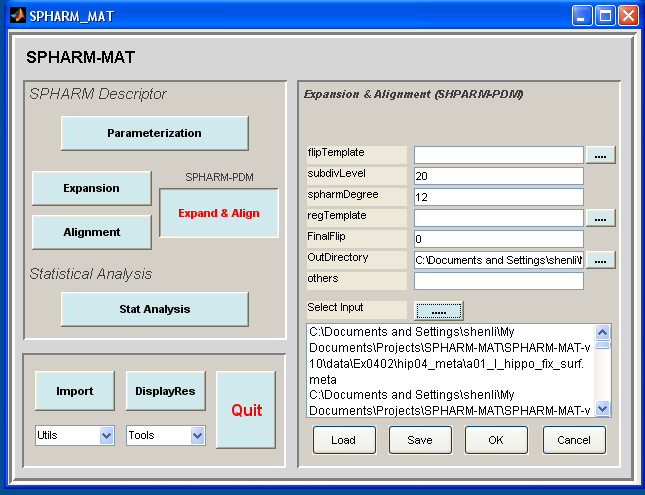
Screen Capture for SPHARM-PDM Expansion
Format Conversion meta_coef2des
Task
Convert COEF coefficient format and META surface format generated by SPHARM-PDM to matlab format
Input
SpharmMatDir/data/Ex0402/hip05_coef/*.coef and SpharmMatDir/data/Ex0402/hip05_coef/*.meta
Output
SpharmMatDir/data/Ex0402/hip06_des/*_des.mat
Steps
- Make an output directory SpharmMatDir/data/Ex0402/hip06_des/
- Run SPHARM_MAT.m under Matlab
- Select FormatConvert under the Utils pop-up menu (bottom-left corner)
- In the right panel, let Method be meta_coef2des
- In the right panel, select SpharmMatDir/data/Ex0402/hip06_des/ as OutDirectory
- In the right panel, click ..... button next to Select Input, and select all the *_surfSPHARM.coef *_surfSPHARM.meta files under SpharmMatDir/data/Ex0402/hip05_coef/ as input files
- Click OK button (See Screen shot for Format Conversion meta_coef2des.)
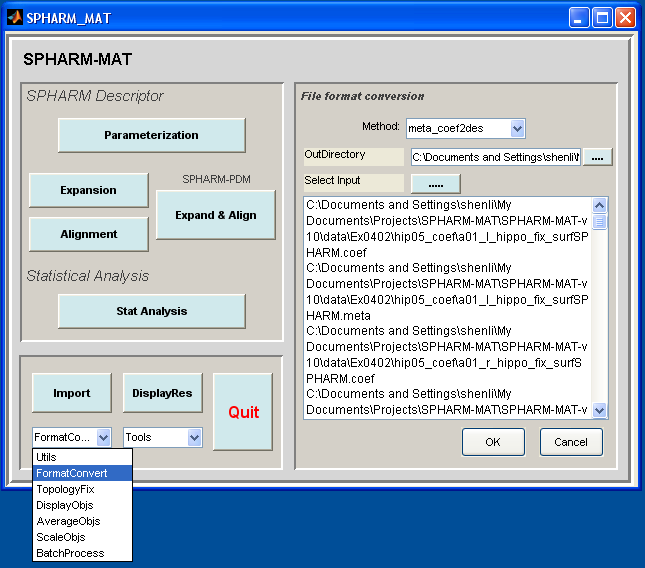
Screen shot for Format Conversion meta_coef2des.
Notes
- This conversion packages *.coef (SPHARM coefficents) and *.meta (Surface reconstruction created by SPHARM-PDM) into a single *_des.mat file. Therefore, the surface in the resulting *_des.mat file is a SPHARM reconstruction generated by SPHARM-PDM instead of the original object surface. See also Data Structure.
- SPHARM-PDM stores only real parts of the coefficients in *.coef files. See also SPHARM Expansion PDM Difference.
Surface Visualization (quad64, Mesh)
Task
Visualize SPHARM reconstructions in the object space
Input
SpharmMatDir/data/Ex0402/hip06_des/*_des.mat
Output
SpharmMatDir/data/Ex0402/hip06_des/PNG/*.png
Steps
Select DisplayObjs under the Utils pop-up menu (bottom-left corner)
Be sure to run this experiments twice by setting different configurations in the right panel as follows
- Run 1 (SPHARM-PDM reconstructions converted from *.meta files ): let Space be object, Mesh be orig, Shade be mesh, Overlay be none, Export be png, Degree be empty
- Run 2 (SPHARM reconstruction using coefficients up to degree 12): let Space be object, Mesh be quad64, Shade be mesh, Overlay be none, Export be png, Degree be 12
In the right panel, click ..... button next to Select Input, and select all the SpharmMatDir/data/Ex0402/hip06_des/*_des.mat files as the input files
Click OK button (See Screen Capture for Surface Visualization (quad64, Mesh))

Screen Capture for Surface Visualization (quad64, Mesh)
Notes
- The visualization results are saved as PNG files under SpharmMatDir/data/Ex0402/hip06_des/PNG/.
- The surface reconstruction generated by SPHARM-PDM and then converted into *_des.mat is shown as the left panel of Surface Visualization (quad64, Mesh), where the underlying mesh used in reconstruction is an icosahedron subdivision. The surface reconstructed using coefficients up to degree 12 is shown as the right panel of Surface Visualization (quad64, Mesh), where the underlying mesh used in reconstruction is a 64-by-64 spherical mesh.
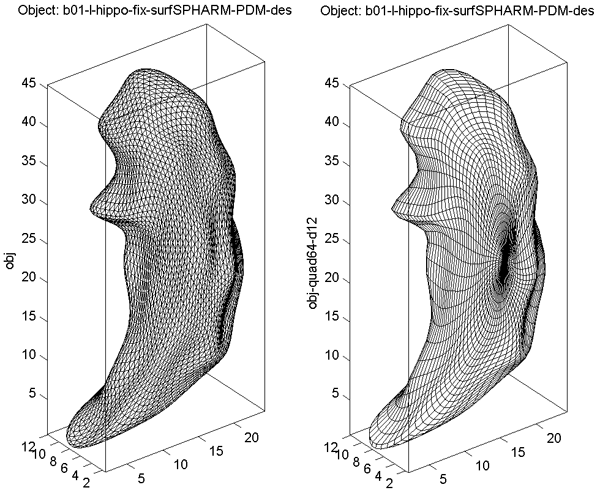
Surface Visualization (quad64, Mesh)