Statistical Analysis
After registering all the individual SPHARM models to a template model, all the SPHARM coefficients are normalized and comparable across objects, and then group analysis can be performed. In SPHARM-MAT, two simple statistical components are implemented to demonstrate its capability for group analysis.
The first component (see Exercise 6.1 T Test) aims to quantify and localize shape changes between two groups of objects. The basic processing pipeline includes the following steps: (1) uniformly sample each SPHARM surface to create a landmark representation; (2) surface signal extraction using different schemes (see [Shen2006b]); (3) perform a t-test on surface signals and visualize the result (e.g., t-map, uncorrected p-map) on the surface.
The second component (see Exercise 6.2 PCA) aims to establish a statistical shape model for one group of 3D objects by characterizing the mean and variability of the population. An ideal model should involve a small number of variables (i.e., simple) but capture major characteristics of the group (i.e., representative). Principal component analysis (PCA) is applied to SPHARM coefficients and characterize the shape group using the PCA eigenmodes. The first few principal components often explain most of the data variance and can be used to create a good statistical shape model that summarizes the whole group. Visualization can also be created for intuitive understanding of the group characteristics.
For more complicated statistical models, we suggest that SurfStat [Worsley2008] should be considered. Surfstat is a free software tool which performs statistical analysis of univariate and multivariate surface and volumetric data using linear mixed effects models and random field theory. Since SurfStat is also matlab-based, it is straightforward to integrate SurfStat with SPHARM-MAT for statistical surface analysis. For example, one can first use SPHARM-MAT to model and align surfaces and extract surface signals, and then use SurfStat for statistical inference on the surface.
Exercise 6.1 T Test
This exercise was tested on a WinXP machine (3GHz CPU, 3.25G RAM) running Matlab 7.7.0 (R2008b). It took a few minutes to finish.
Major Steps
- T Test
- Stat Visualization
T Test
Task
Perform a vertex-by-vertex t test on a surface manifold.
Input
SpharmMatDir/data/Ex0601/hip06_reg/*_reg.mat: This folder is a copy of SpharmMatDir/data/Ex0502/hip06_reg/*_reg.mat. Group 1 contains a*_reg.mat objects and Group 2 contains b*_reg.mat objects
SpharmMatDir/data/Ex0601/hip07_atlas/atlas.mat: The template surface or atlas
Output
SpharmMatDir/data/Ex0601/hip08_stat/*.mat: Resulting statistics
Steps
- Make an output directory SpharmMatDir/data/Ex0601/hip08_stat/
- Run SPHARM_MAT.m under Matlab
- Click Stat Analysis button
- In the right panel, let Method be t_map
- In the right panel, let Atlas be SpharmMatDir/data/Ex0601/hip07_atlas/atlas.mat, Smoothing_FWHM be 5, EqualVariance be Yes, Signal be vl_defm_nrm, SampleMesh be icosa3, OutputNamePrefix be t_map, OutDirectory be SpharmMatDir/data/Ex0601/hip08_stat, GroupIDs be Ctrl,PT,
- In the right panel, click ..... button next to Group1, and select all the a*_reg.mat files under SpharmMatDir/data/Ex0601/hip06_reg as Group 1 files
- In the right panel, click ..... button next to Group2, and select all the b*_reg.mat files under SpharmMatDir/data/Ex0601/hip06_reg as Group 2 files
- Click OK button (See Screen Capture for T Test)
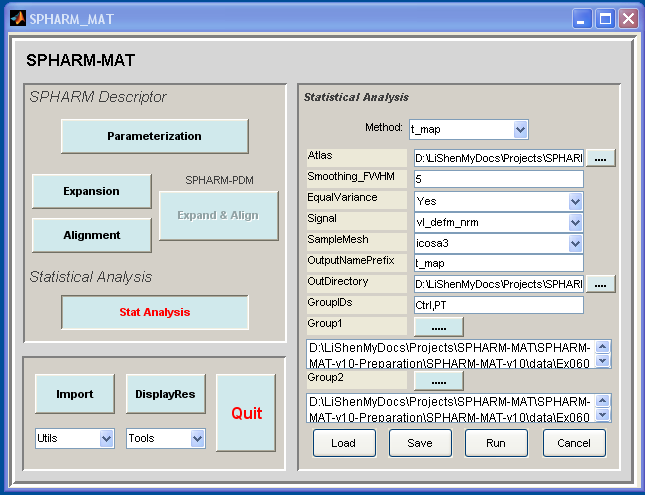
Screen Capture for T Test
Stat Visualization
Task
Visualize statistical maps: t-map and p-map
Input
SpharmMatDir/data/Ex0601/hip08_stat/t_map*.mat
Output
Figure on the screen
Steps
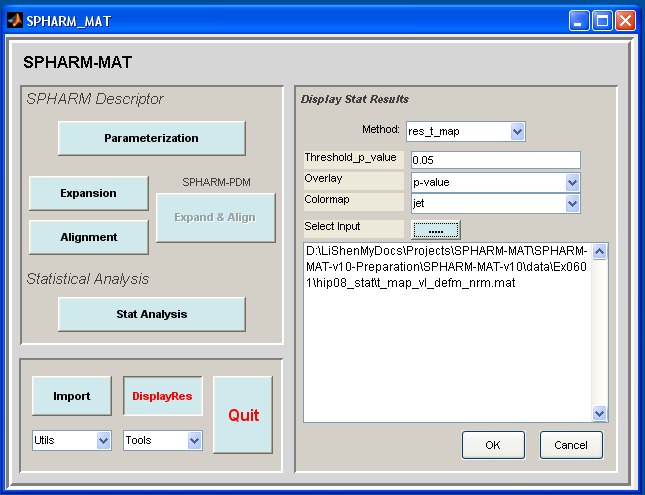
Click DisplayRes button
In the right panel, let Method be res_t_map, Threshold_p_value be 0.05, Colormap be jet
- Be sure to run this experiments twice by setting different configurations in the right panel as follows
- Run 1: let Overlay be t-map
- Run 2: let Overlay be p-value
In the right panel, click ..... button next to Select Input, and select the t_map*.mat files under SpharmMatDir/data/Ex0601/hip08_stat
Click OK button (See Screen Capture for Stat Visualization)
Screen Capture for Stat Visualization
Notes
- The visualization results are rendered on the screen (see Stat Visualization (t-map, p-map))
- Only significant regions (uncorrected p<0.05) are color-mapped
- For getting corrected p values, see [Worsley2008] and [Chung2005]

Stat Visualization (t-map, p-map)
Relevant Information
Useful Tips
Exercise 6.2 PCA
This exercise was tested on a WinXP machine (3GHz CPU, 3.25G RAM) running Matlab 7.7.0 (R2008b). It took a few minutes to finish.
Major Steps
- PCA
- PCA Visualization
PCA
Task
Perform principal component analysis on SPHARM coefficients.
Input
SpharmMatDir/data/Ex0602/hip06_reg/*_reg.mat: This folder is a copy of SpharmMatDir/data/Ex0502/hip06_reg/*_reg.mat
Output
SpharmMatDir/data/Ex0602/hip07_stat/PCA_stat*.mat: Resulting statistics
Steps
- Make an output directory SpharmMatDir/data/Ex0602/hip07_stat/
- Run SPHARM_MAT.m under Matlab
- Click Stat Analysis button
- In the right panel, let Method be PCA
- In the right panel, let GroupID be All, OutputName be PCA_stat.mat, OutDirectory be SpharmMatDir/data/Ex0602/hip07_stat
- In the right panel, click ..... button next to Select Input, and select all the *_reg.mat files under SpharmMatDir/data/Ex0602/hip06_reg as input files
- Click OK button (See Screen Capture for PCA)
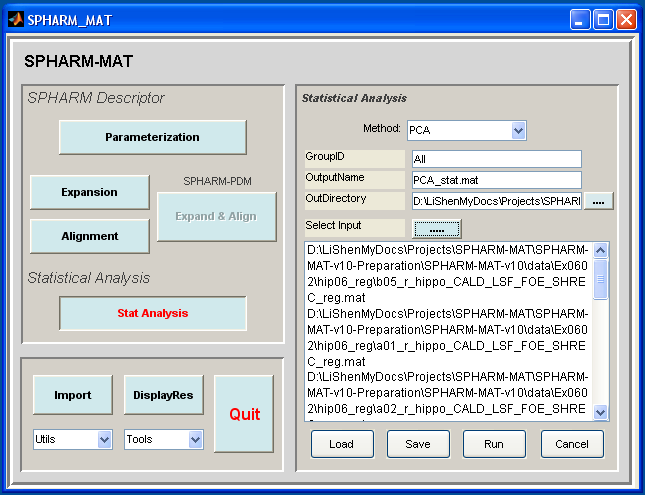
Screen Capture for PCA
PCA Visualization
Task
Visualize PCA modes
Input
SpharmMatDir/data/Ex0602/hip07_stat/PCA_stat*.mat
Output
Figure on the screen
Steps
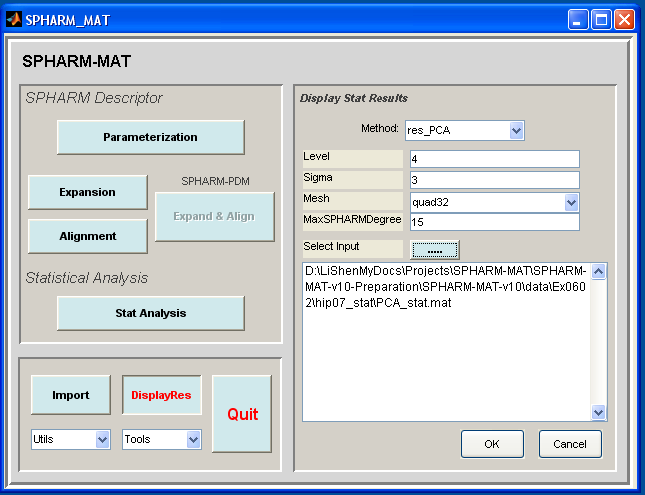
- Click DisplayRes button
- In the right panel, let Method be res_PCA
- In the right panel, let Level be 4, Sigma be 3, Mesh be quad32, MaxSPHARMDegree be 15,
- In the right panel, click ..... button next to Select Input, and select the PCA_stat*.mat files under SpharmMatDir/data/Ex0602/hip07_stat
- Click OK button (See Screen Capture for PCA Visualization)
Screen Capture for PCA Visualization
Notes
- The visualization results are rendered on the screen (see PCA Visualization)
- For details about such a visualization, see [Shen2008]
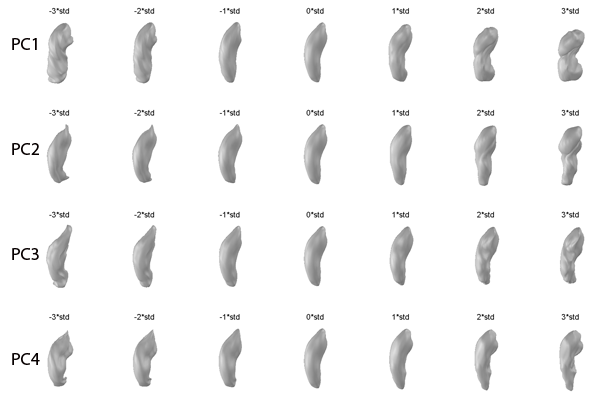
PCA Visualization
Relevant Information
Useful Tips