Other Utilities
This chapter demonstrates three SPHARM-MAT utilities.
Exercise 7.1 Import shows how to import (1) binary images stored as nifti and analyze files and (2) surface objects stored as stl and Amira matlab files.
Exercise 7.2 Average Objects shows how to create an average surface, which can be used as the atlas in group analysis. In a typical study, you can select a set of control objects and run this utility to create an atlas that represents an average normal surface. This utility implements the following steps: (1) let the atlas be the first model; (2) align each model to the atlas using SHREC; (3) let the atlas be the mean of all the data; and (4) repeat (2) and (3) until the atlas converges. See Surface Visualization (icosa4) for an example atlas. Once the atlas is created, you can use SHREC to register all the individual objects to the atlas (instead of using an individual object as the template, which was used in Exercise 5.2 SHREC Alignment).
Exercise 7.3 Scale Objects shows how to scale a set of SPHARM objects. The scaling factors need to be pre-computed by users and provided as a csv file as an input file.
Exercise 7.1 Import
This exercise was tested on a WinXP machine (3GHz CPU, 3.25G RAM) running Matlab 7.7.0 (R2008b). It took a few minutes to finish.
Major Steps
- Import
- Surface Visualization (Solid with Mesh)
Import
Task
Import surface meshes and binary objects of various different formats
Input
SpharmMatDir/data/Ex0701/hip00_org/*_surf.m: Amira matlab surface mesh
SpharmMatDir/data/Ex0701/hip00_org/*_bim.*: Analyze binary objects
SpharmMatDir/data/Ex0701/hip00_org/*_surf.stl: STL surface mesh
Output
SpharmMatDir/data/Ex0701/hip01_res/*_obj.mat: Surface meshes
SpharmMatDir/data/Ex0701/hip01_res/*_bim.mat: Binary objects
Steps
Make an output directory SpharmMatDir/data/Ex0701/hip01_res
Run SPHARM_MAT.m under Matlab
Click Import button
In the right panel, let ResampleFactor be 1
In the right panel, select SpharmMatDir/data/Ex0701/hip01_res as OutDirectory
Be sure to run this experiment three times by selecting the following files as input files
- *_surf.m files under SpharmMatDir/data/Ex0701/hip00_org
- *_bim.hdr files under SpharmMatDir/data/Ex0701/hip00_org
- *_surf.stl files under SpharmMatDir/data/Ex0701/hip00_org
Click OK button (See Screen Capture for Import)
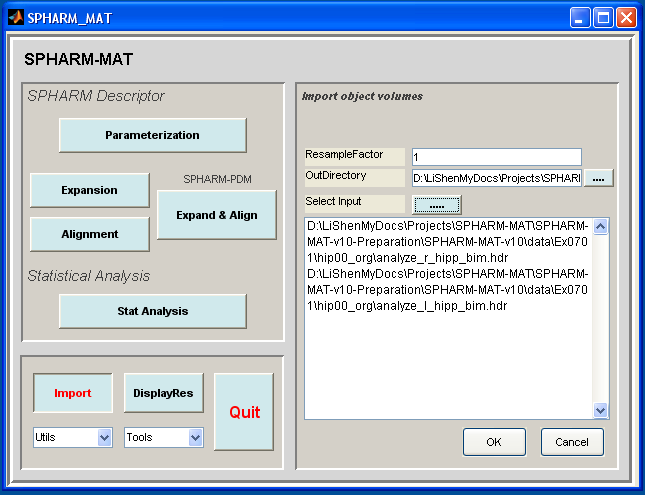
Screen Capture for Import
Surface Visualization (Solid with Mesh)
Task
Visualize binary objects or surface meshes
Input
SpharmMatDir/data/Ex0701/hip01_res/*.mat
Output
SpharmMatDir/data/Ex0701/hip01_res/PNG/*.png
Steps
- Select DisplayObjs under the Utils pop-up menu (bottom-left corner)
- In the right panel, let Space be object, Mesh be orig, Shade be both, Overlay be none, Export be png, Degree be empty
- In the right panel, click ..... button next to Select Input, and select all the SpharmMatDir/data/Ex0701/hip01_res/*.mat files as input files
- Click OK button (See Screen Capture for Surface Visualization (Solid with Mesh))
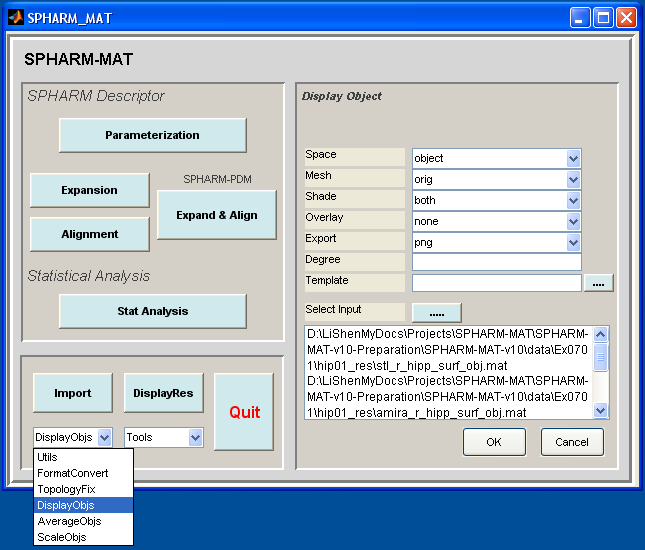
Screen Capture for Surface Visualization (Solid with Mesh)
Notes
- The visualization results are saved as PNG files under SpharmMatDir/data/Ex0701/hip01_res/PNG
- Sample visualization results are shown in Surface Visualization (Solid with Mesh).
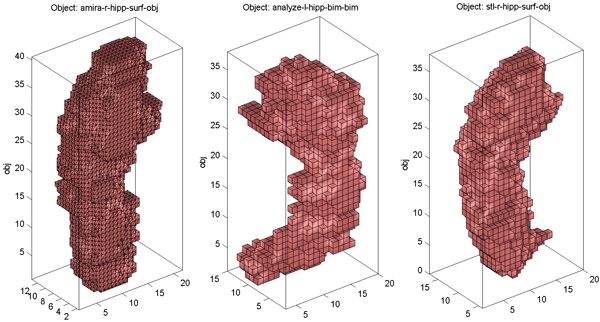
Surface Visualization (Solid with Mesh)
Relevant Information
Useful Tips
Exercise 7.2 Average Objects
This exercise was tested on a WinXP machine (3GHz CPU, 3.25G RAM) running Matlab 7.7.0 (R2008b). It took a few minutes to finish.
Major Steps
- Average Objects
- Surface Visualization (icosa4)
Average Objects
Task
Create an average by iteratively aligning all the individual objects together
Input
SpharmMatDir/data/Ex0702/hip05_prm/*_prm.mat: This folder is a subset of SpharmMatDir/data/Ex0501/hip05_reg/alignParam/*_prm.mat, where only right hippocampi of controls are included.
Output
SpharmMatDir/data/Ex0702/hip06_reg/*.*: atlas.mat is the average, *_als.mat files are individuals registered to the atlas.
Steps
- Make an output directory SpharmMatDir/data/Ex0702/hip05_prm/
- Run SPHARM_MAT.m under Matlab
- Select AverageObjs under the Utils pop-up menu (bottom-left corner)
- In the right panel, let OutputName be atlas.
- In the right panel, select SpharmMatDir/data/Ex0702/hip06_reg as OutDirectory
- In the right panel, click ..... button next to Select Input, and select all the *_prm.mat files under SpharmMatDir/data/Ex0702/hip05_prm as input files
- Click OK button (See Screen Capture for Average Objects)
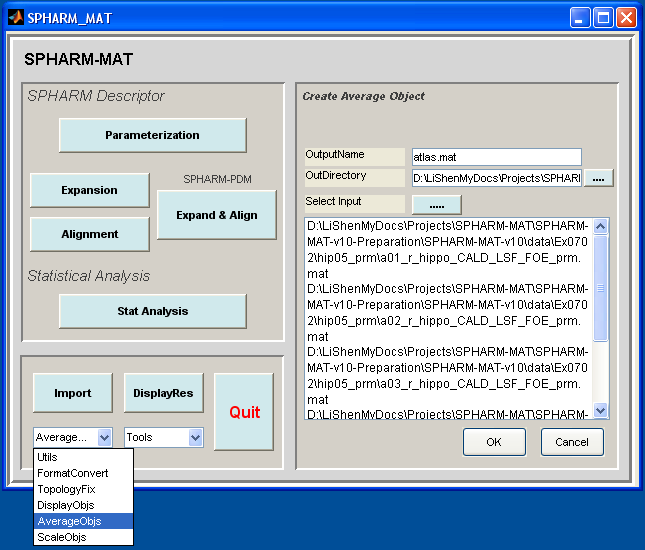
Screen Capture for Average Objects
Surface Visualization (icosa4)
Task
Visualize SPHARM reconstructions in the object space
Input
SpharmMatDir/data/Ex0702/hip06_reg/*_alt.mat
Output
SpharmMatDir/data/Ex0702/hip06_reg/PNG/*.png
Steps
- Select DisplayObjs under the Utils pop-up menu (bottom-left corner)
- In the right panel, let Space be object, Mesh be icosa4, Shade be both, Overlay be adc_paramap, Export be png, Degree be empty
- In the right panel, click ..... button next to Select Input, and select all the SpharmMatDir/data/Ex0702/hip06_reg/*_des.mat files as the input files
- Click OK button (See Screen Capture for Surface Visualization (icosa4))

Screen Capture for Surface Visualization (icosa4)
Notes
- The visualization results are saved as PNG files under SpharmMatDir/data/Ex0702/hip06_reg/PNG/.
- In Surface Visualization (icosa4), the average object (i.e., the atlas) is shown in the left panel, while two sample individuals registered to the atlas are shown in the middle and right panels respectively.
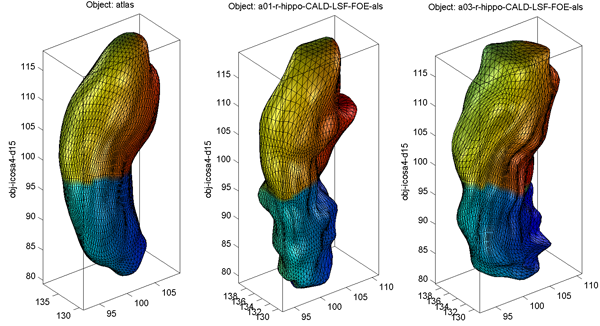
Surface Visualization (icosa4)
Relevant Information
Useful Tips
Exercise 7.3 Scale Objects
This exercise was tested on a WinXP machine (3GHz CPU, 3.25G RAM) running Matlab 7.7.0 (R2008b). It took a few minutes to finish.
Major Steps
- Scale Objects
- Surface Visualization (orig, icosa4)
Scale Objects
Task
Scale objects using user-specified scaling information
Input
SpharmMatDir/data/Ex0703/hip04_des/*_des.mat: This folder is a copy of SpharmMatDir/data/Ex0401/hip04_des/*_des.mat.
SpharmMatDir/data/Ex0703/hip05_scl/volume_sf.csv: User-specified scaling factors
Output
SpharmMatDir/data/Ex0703/hip05_scl/*_scl_des.mat
Steps
- Make an output directory SpharmMatDir/data/Ex0703/hip05_scl/
- Run SPHARM_MAT.m under Matlab
- Select ScaleObjs under the Utils pop-up menu (bottom-left corner)
- In the right panel, let ScalingFactor be SpharmMatDir/data/Ex0703/hip05_scl/volume_sf.csv.
- In the right panel, select SpharmMatDir/data/Ex0703/hip05_scl as OutDirectory
- In the right panel, click ..... button next to Select Input, and select all the *_des.mat files under SpharmMatDir/data/Ex0703/hip04_des as input files
- Click OK button (See Screen Capture for Scale Objects)
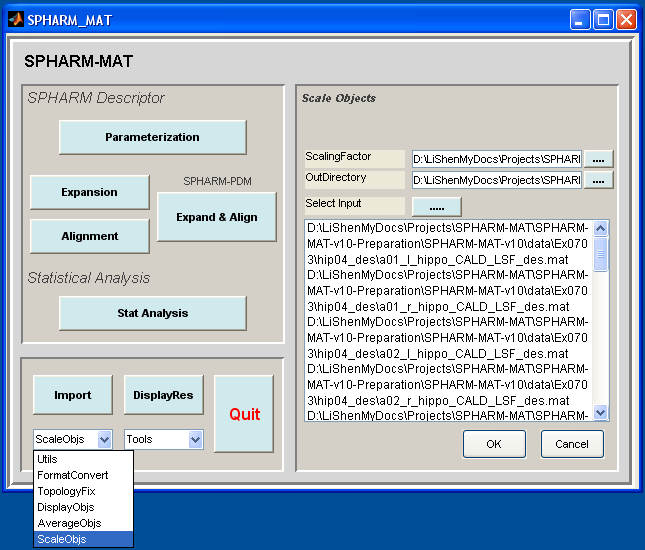
Screen Capture for Scale Objects
Surface Visualization (orig, icosa4)
Task
Visualize original surface and SPHARM reconstructions in the object space
Input
SpharmMatDir/data/Ex0703/hip04_des/*_des.mat: before scaling
SpharmMatDir/data/Ex0703/hip05_scl/*_scl_des.mat: after scaling
Output
SpharmMatDir/data/Ex0703/hip04_des/PNG/*.png
SpharmMatDir/data/Ex0703/hip05_scl/PNG/*.png
Steps
Select DisplayObjs under the Utils pop-up menu (bottom-left corner)
Be sure to run this experiments four times by setting different configurations in the right panel as follows
- Run 1 and Run 3: let Space be object, Mesh be orig, Shade be both, Overlay be adc_paramap, Export be png, Degree be empty
- Run 2 and Run 4: let Space be object, Mesh be icosa4, Shade be both, Overlay be adc_paramap, Export be png, Degree be empty
In the right panel, click ..... button next to Select Input, and select the following files in four different runs respectively
- Run 1 and Run 2: SpharmMatDir/data/Ex0703/hip04_des/*_des.mat
- Run 3 and Run 4: SpharmMatDir/data/Ex0703/hip05_scl/*_scl_des.mat
Click OK button (See Screen Capture for Surface Visualization (orig, icosa4))

Screen Capture for Surface Visualization (orig, icosa4)
Notes
- The visualization results are saved as PNG files under SpharmMatDir/data/Ex0703/hip04_des/PNG and SpharmMatDir/data/Ex0703/hip05_scl/PNG.
- In Surface Visualization (orig, icosa4), the original surface and its SPHARM reconstruction before scaling are shown in the left two panels, while the results after scaling are shown in the right panels. Although the shapes are the same, the scales on the axes are different.
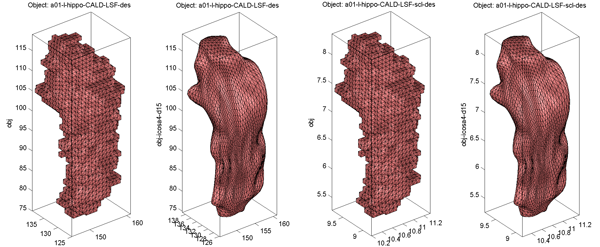
Surface Visualization (orig, icosa4)
Relevant Information
Useful Tips